

Dashboard
The Dashboard is the builder home at /studio — a dense workspace overview for monitoring agents, models, training, and recent activity.
Top widgets
Section titled “Top widgets”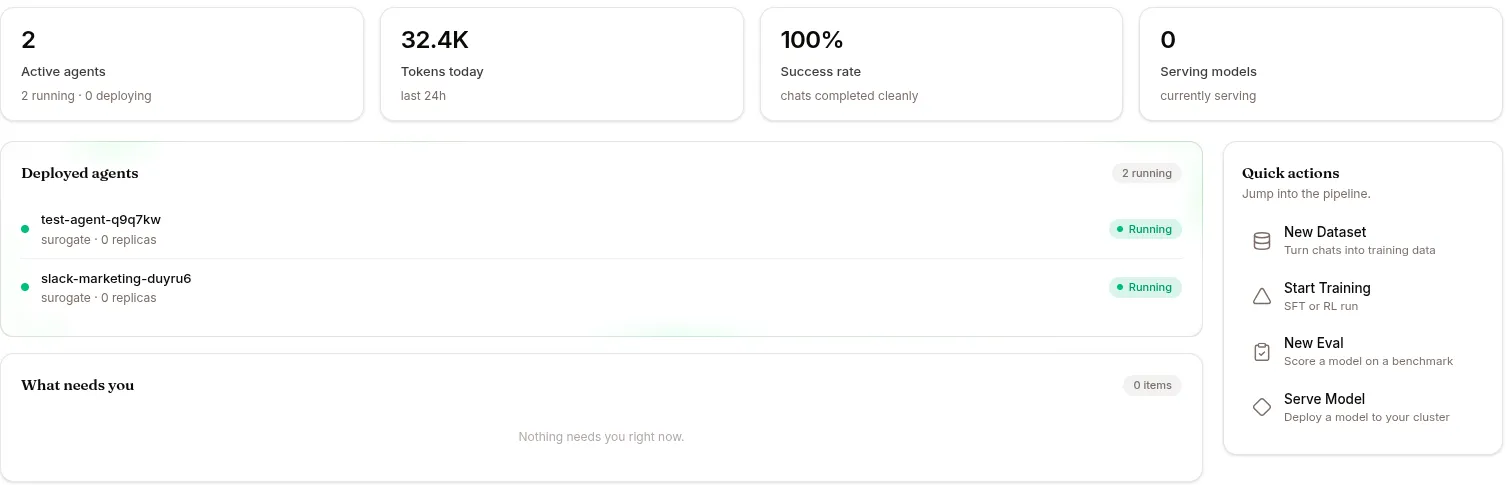
- Active Agents — running / deploying / error breakdown
- Tokens today — total LLM tokens consumed in the last 24h
- Success Rate — % of sessions completed without crashing or being denied
- Per-agent live table — agent, status, replicas, CPU, MEM, RPS, P99, model
Lower sections
Section titled “Lower sections”- Serving Models — fine-tuned models currently being served
- Training Jobs — active SFT / GRPO runs
- Eval Runs — active evaluation runs
- Recent Conversations — feed of recent sessions across all agents
- Filter chips: All / Flagged
Quick Actions
Section titled “Quick Actions”Five shortcut buttons:
| Button | What it opens |
|---|---|
| New Dataset | NEW DATASET picker |
| Start Training | The NEW RUN form on the Training page (SFT or GRPO) |
| New Eval | NEW EVALUATION wizard |
| Serve Model | DEPLOY MODEL dialog (Local Hub / HF / OpenRouter / URL) |
| New Expert | Create an expert (a skill backed by a fine-tuned model) |
Each opens the same modal/wizard you’d reach by navigating to its module page.
Daily ops habit
Section titled “Daily ops habit”A common builder workflow:
- Morning: open the dashboard.
- Glance at success rate and error count. Drill into errors if any.
- Check Recent Conversations → Flagged. Triage the worst sessions.
- Quick Actions when something needs urgent attention (deploy a hot-fix agent, start a small fine-tune).
What’s next
Section titled “What’s next”Copilot for the platform-driving agent. Templates for the deploy flow.