The Overview
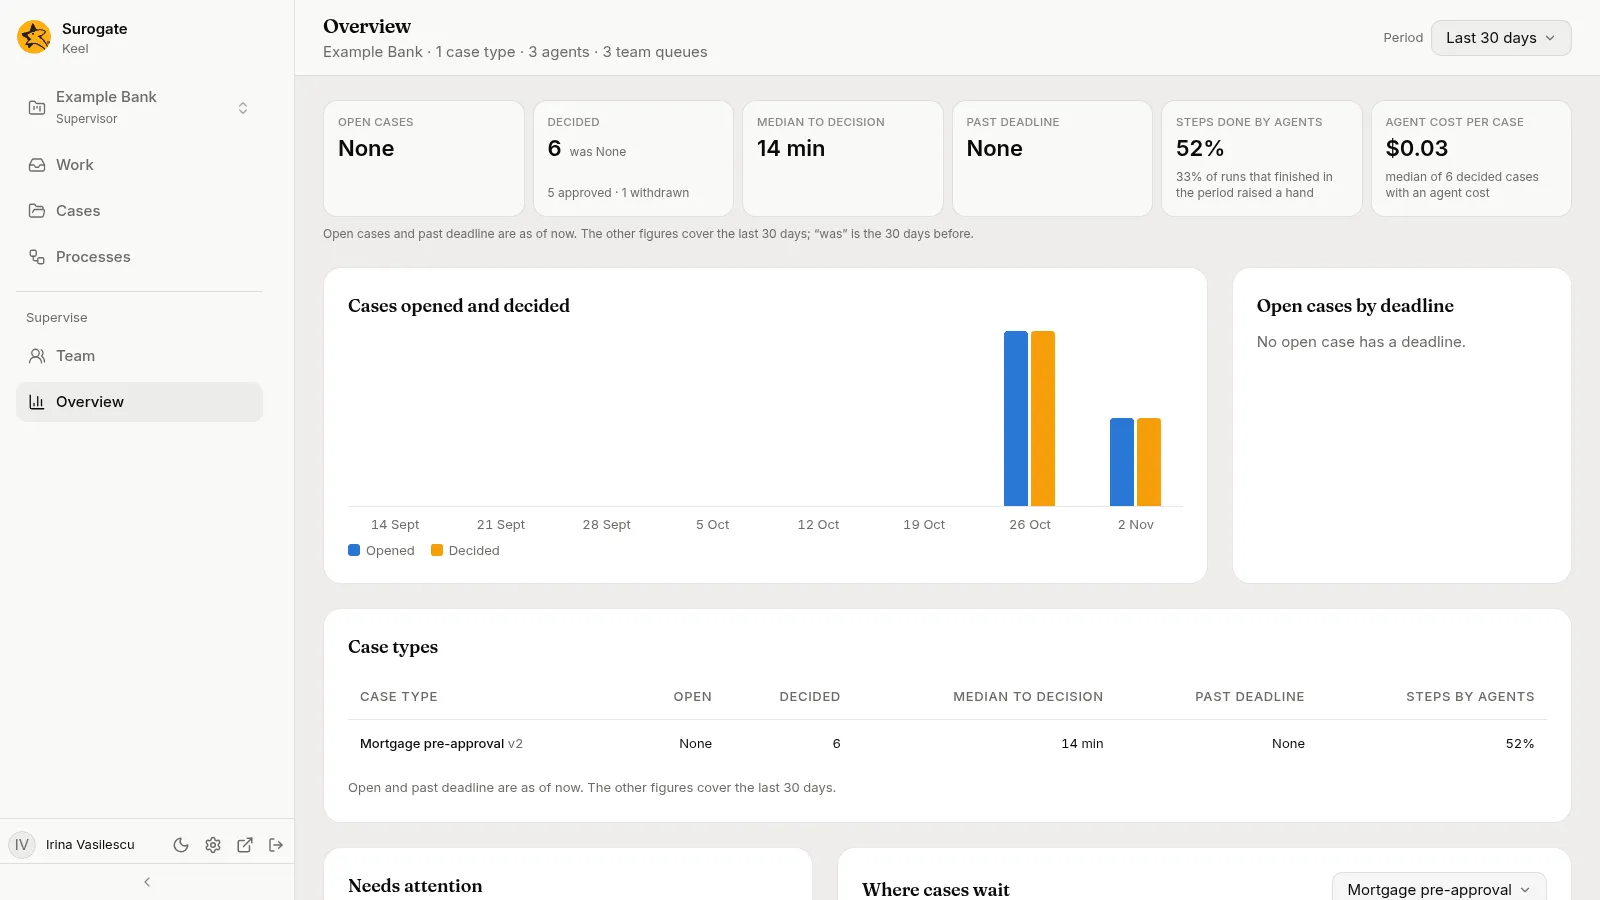
The Overview shows a project’s supervisors how the project is doing: how many cases are open and decided, what needs attention, how each case type is doing and where cases wait. It counts cases and shows none of their content. It never counts a process’s instances: supervisors find the processes’ figures on the Processes page.
Only supervisors have the Overview row, after Team in the left rail (see The Team page). Staff who are not supervisors and open its address read “Only the project’s supervisors see the overview.” with Back to work. A supervisor demoted while the page is open reads the same.
The header names the project and counts its case types, agents and team queues, such as Lending · 2 case types · 1 agent · 1 team queue. A count that could not be read is left out.
Period
Section titled “Period”Period offers Last 7 days, Last 30 days and Last 90 days. It opens on 30 days. Open cases and past deadline are counted as of now. The other figures cover the period, and the tiles say “was” for the period of the same length before it. In Needs attention, only the agent items depend on the period; waits and queues are as of now.
The address keeps the period and the case type, so a link shares them. While a new period loads, each part keeps the last answer, dimmed.
Figures
Section titled “Figures”Six tiles, with the caption “Open cases and past deadline are as of now. The other figures cover the last 30 days; “was” is the 30 days before.”
| Tile | What it shows |
|---|---|
| Open cases | Cases open now, with across 3 case types: the case types that have one. |
| Decided | Cases decided in the period, a case being decided when it closes. was 401 is the period before. Under it, how they were resolved, the most first, such as 412 approved · 74 declined. |
| Median to decision | The median time from the start of a case to its decision, over the cases decided in the period, such as 2.3 d, with was 3.9 d. |
| Past deadline | Open cases past their deadline now, with 4 waiting at Valuation report: the step most of them wait at. |
| Steps done by agents | Of the steps done in the stages that cases left in the period, the share agents did, such as 71% with was 64%. Under it: 6% of runs that finished in the period raised a hand. |
| Agent cost per case | The median cost of the cases decided in the period that have an agent cost, in dollars, such as $2.90 with was $3.10. Under it: median of 412 decided cases with an agent cost. |
A figure with nothing to measure reads —, and a count of none reads None. Median to decision, Steps done by agents and Agent cost per case say no “was” when the period before has nothing to measure. Decided then reads was None. Open cases and Past deadline have none. A rate above 0 never reads 0%; it reads <1%. A rate below 100% never reads 100%; it reads >99%. A cost below a cent keeps two significant digits, such as $0.0042.
Cases by week and by deadline
Section titled “Cases by week and by deadline”Under the tiles, two charts show how cases come and go. Neither follows Period.
- Cases opened and decided draws, for each of the last eight weeks, how many cases opened and how many were decided, each week labelled by its Monday, such as
26 Oct. With none, it says “No case was opened or decided in these weeks.” - Open cases by deadline is a ring of the open cases that have a deadline: On time, Due within 24 hours and Past deadline, with the share on time in the middle. Under it, a line such as “3 more have no deadline.” counts the open cases without one. With no open case that has a deadline, it says “No open case has a deadline.”
At the bottom of the page, two tips: “The weekly bars always cover the last eight weeks, whatever the period above.” and “A queue running short? Add a member from Team, or raise someone’s authority limit there.”
Needs attention
Section titled “Needs attention”Needs attention lists what a supervisor should look at, at most five items of each kind: agents first, then waits, then queues. Each item has a tag, a title, a sentence and a link to the page where you can act. When nothing qualifies, it says “Nothing needs attention.”
| Tag | Title | Sentence and link |
|---|---|---|
| Agent | “Checks failing more often” or “Raising hands more often” | “Underwriting agent failed a check on 6% of its runs that finished in the last 30 days, up from 3% the 30 days before.” For hands: “Underwriting agent raised a hand on 6% of its runs that finished in the last 30 days, up from 3% the 30 days before.” The agent shows by name only, or as “Unnamed agent”; see Working with agents. Open the agents opens the Team page on its Agents tab. |
| Deadline | “4 cases past deadline at Valuation report” | “They wait on a third party in Loan request, the oldest since 16 Oct. 6 cases are past deadline in all.” The wait is on the client or a third party. Open the cases opens the Past deadline tab of the Cases page, narrowed to the case type and stage. |
| Queue | “Underwriting is short of hands” | “23 items waiting for 5 members, the oldest since 19 Oct.” A queue with no member reads “4 items waiting and no member, the oldest since 19 Oct.” Open the queue opens the queue on the Work page. |
Within each kind the largest comes first: the agent whose rate rose most, the wait holding most cases, the queue with most items waiting. A date in an earlier year carries its year. Your administrator sets when an agent, a wait or a queue is listed.
Case types
Section titled “Case types”Case types has a row for each published case type, by name, with its version:
| Column | What it shows |
|---|---|
| Case type | The name and the version, such as Loan request v3. |
| Open | Cases open now. |
| Decided | Cases decided in the period. |
| Median to decision | Their median time to a decision. |
| Past deadline | Open cases past their deadline now. |
| Steps by agents | The share of steps done by agents in the period. |
The caption under it reads “Open and past deadline are as of now. The other figures cover the last 30 days.” With no case type published, the card says “No case type is published in this project yet.” and the chart below it is not shown.
Where cases wait
Section titled “Where cases wait”Where cases wait draws one case type at a time: the one with the most open cases, or the first by name on a tie. A picker beside the heading lists the project’s case types by name. The page says “Median time in each stage over the last 30 days, by who the case waited on.”
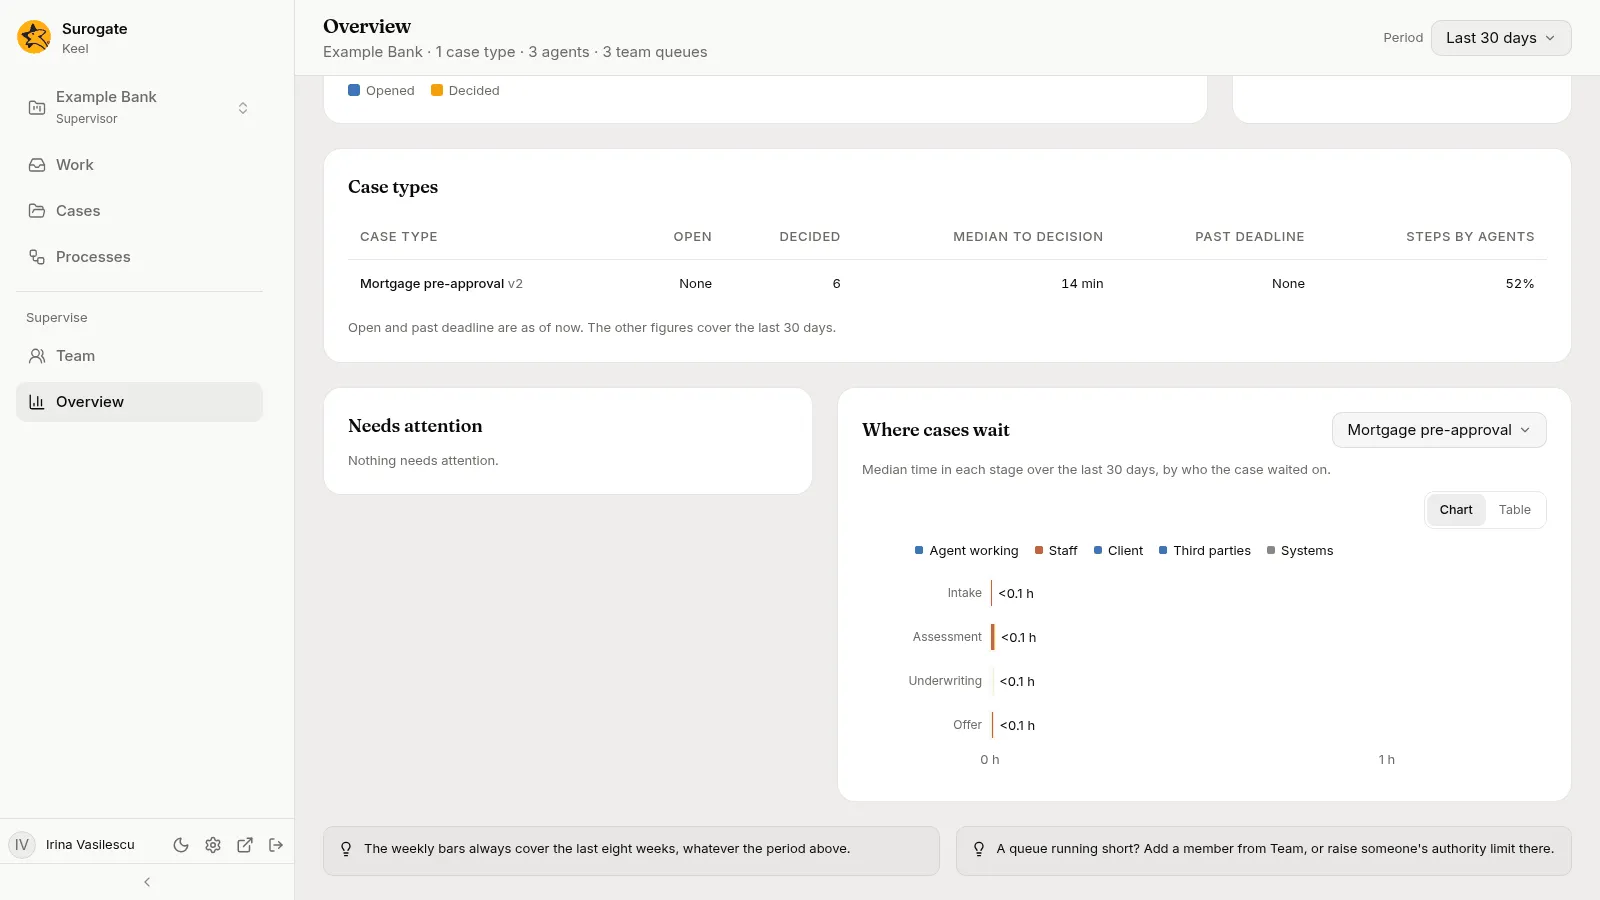
The chart has a bar for each stage a case left in the period, in the order of the case type’s stages. Each bar is split by who held the case: Agent working, Staff, Client, Third parties and Systems. It ends in the stage’s median, with the wait that held the stage longest beside it when a client or a third party held it. The scale is in hours, or in days when any stage’s median is a day or more. Pointing at a segment shows its time. On a phone the bar ends in the median alone.
The buttons Chart and Table switch the view. It opens on Chart, and your browser remembers your choice. The table gives the numbers of the same stages, in the same unit as the chart:
| Column | What it shows |
|---|---|
| Stage | The stage’s name. |
| Visits | How many times a case left the stage in the period. |
| Median | Their median time in the stage. |
| Agent working, Staff, Client, Third parties, Systems | The median split by who held the case. |
| Longest wait | The wait that held the stage longest, or —. |
When no case left a stage in the period, the card says “No Loan request case left a stage in the last 30 days.”
When a part cannot be read
Section titled “When a part cannot be read”Each part reads on its own. A part that cannot be read says so, gives Keel’s reason, and offers Try again:
| Part | Title |
|---|---|
| Figures | “The figures could not be loaded” |
| Cases opened and decided, Open cases by deadline | “The chart could not be loaded” |
| Needs attention | “This list could not be loaded” |
| Case types | “The case types could not be loaded” |
| Where cases wait | “The chart could not be loaded” |
When a read took too long, Keel says “The figures took too long to read. Try a shorter period.” Pick a shorter period, or press Try again. After a new period fails to load, the numbers of the last period are not shown as current. When the chart fails, its picker stays, so you can try another case type. If Case types cannot be read, Where cases wait is not shown, because its picker takes the list from it.